ProcedureSEAT > HOME > Procedure
Collection device drawings, layout and axonometric drawing information, equipment, operating procedures, process pipeline VOCs fully compositional analysis and LDAR related parameter and historical test data, and so on, according to the information collected to confirm unit should monitor VOCs characteristic of pollutant, ensure the normal order of the mass spectrometer can implement monitoring (partial characteristics between pollutants may affect each other).
Table 1 monitoring material of aromatic hydrocarbon extraction device
|
Monitoring the material |
Scale range |
Leak threshold |
|
pentane |
0.1-100ppm |
30ppm |
|
hexane |
0.1-100ppm |
26ppm |
|
heptane |
0.1-100ppm |
30ppm |
|
benzene |
0.01-100ppm |
1.7ppm |
|
toluene |
0.01-100ppm |
12ppm |
|
xylene |
0.01-100ppm |
10ppm |
|
Ethyl benzene |
0.01-100ppm |
21ppm |
Note: all material leakage thresholds refer to the requirements of the national occupational health standard of the Peoples Republic of China.
For example, full-component analysis was performed on materials of aromatic extraction device, which mainly contained 7 kinds of media, including pentane, hexane, heptane, benzene, toluene, xylene and ethylbenzene. By monitoring these 7 substances, the mass spectrometer can monitor whether VOCs leakage occurs in the device. Each analysis takes 15 seconds (it takes 15 minutes for the mass spectrometer to complete a round of analysis on 60 monitoring points of the device when it is planned to deploy), and the more monitoring substances, the longer each analysis takes. Therefore, it is necessary to confirm the substance with high content and great harm in the device, and monitor it as VOCs characteristic pollutant, so as to achieve the balance of monitoring material type and analysis time.
(2)site
Enter the site of the device, get familiar with the location and surrounding geographical environment of the device, the equipment layout and pipeline corridor alignment in the device, roughly confirm the meteorological five-parameter sensor and analyze the installation location of the cabin, and preliminarily predict the monitoring site layout range and gas pipeline routing。
(3)LDAR data analysis
Check whether the LDAR files are accurate, supplement the LDAR seal points omitted during the construction, put the LDAR seal points on the equipment, pipe rack or instrument, analyze the equipment leakage degree according to the production process of the device and the LDAR historical test data, and arrange the monitoring points according to the tendency.
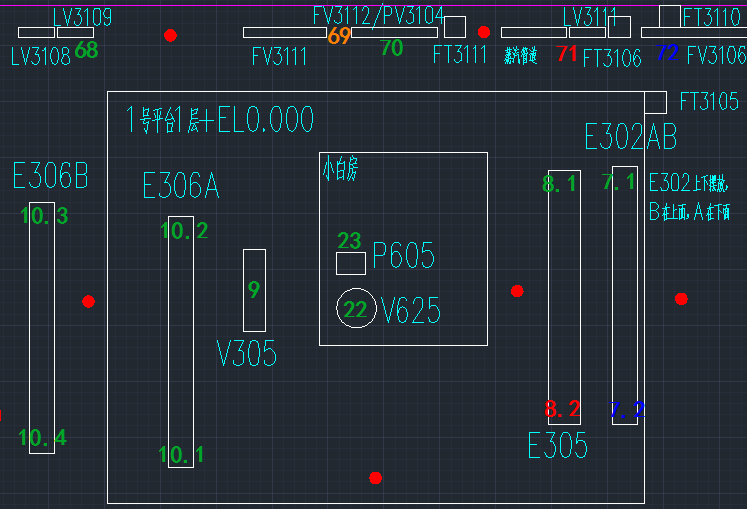
FIG. 1 preliminary layout of LDAR data analysis
Marking on the device layout (pictured above), 7.1, 7.2, 8.1, 8.2, 9, 22, 23, 68, 69 and 70 device such as a representative field involving VOCs sealing point of the small region (based on physical space division), color red, orange, blue and green represent the different levels of leakage, represented by a red dot, monitoring the preliminary layout position, leakage after the traceability analysis and positioning to small areas.
(4)3 d modeling
Conduct field mapping and conduct three-dimensional modeling of the device according to the equipment layout, construction drawings, axle survey and other data, input the device to the traceability system platform as the system display interface (as shown in the following figure). Click the device to display the relevant LDAR sealing point information, and click the monitoring point to display real-time monitoring data.
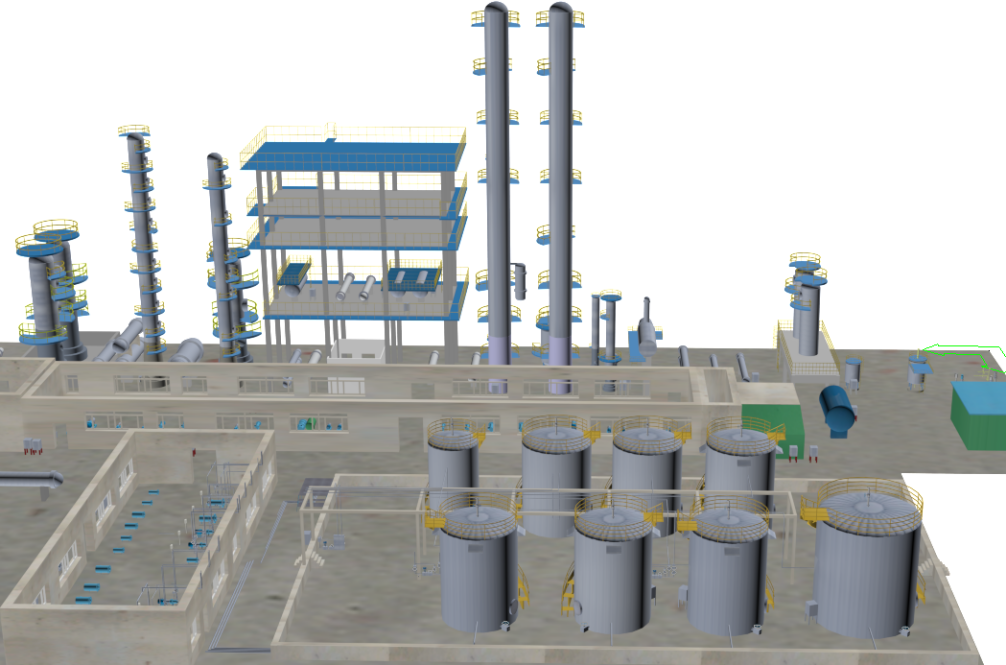
FIG. 2 three-dimensional model of the device
(5)Establish a database of hydrodynamic models
Through the hydrodynamic calculation of the three-dimensional model, the database of the hydrodynamic model of the wind field under different wind directions and wind speeds is generated for subsequent traceability calculation. Refer to the historical wind speed, wind direction and other meteorological information of the location of the device, adjust the position of the monitoring point, and avoid areas such as eddy current, so that the monitoring point can better monitor leakage.
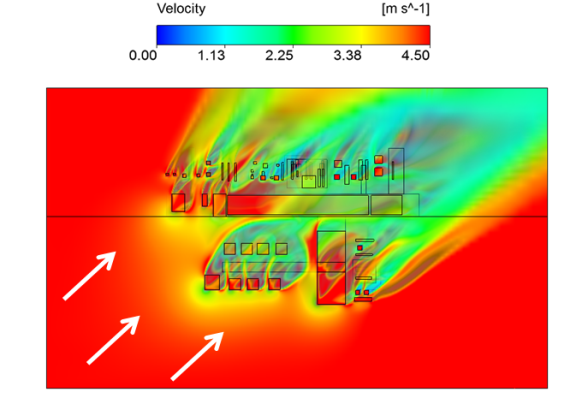
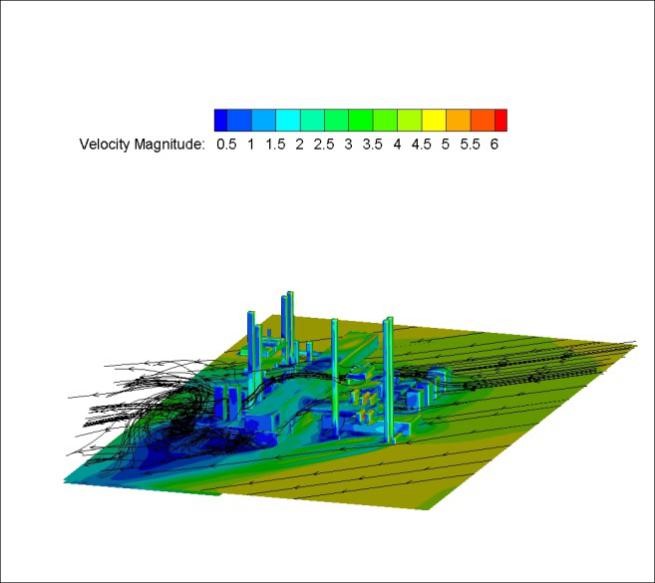
FIG. 3 hydrodynamic model of the device under the northeast wind of 4.5m/s
The figure on the left shows the wind velocity distribution in the device when looking down, and the figure on the right shows the eddy current analysis of the three-dimensional model
(6)Model embedded system platform
Based on the three-dimensional model of the device, real-time monitoring data and highlighting of the leakage area are added to it. The system platform is placed in the server, and the owner can operate, inquire and monitor in the central control room.
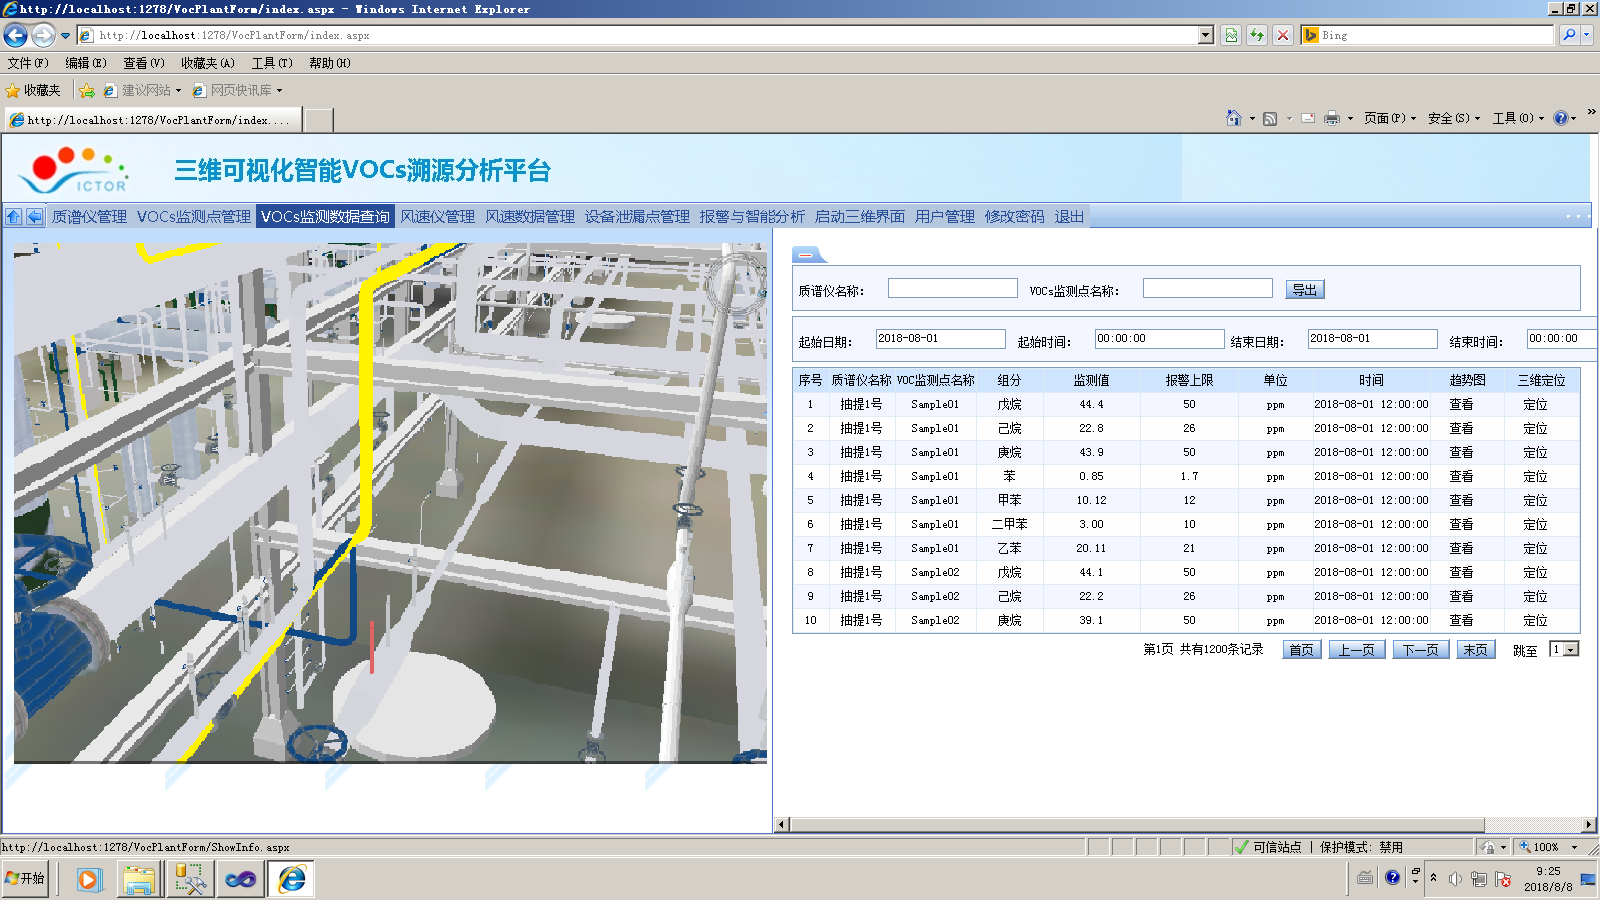
Figure 4 click the monitoring point to display the corresponding monitoring information
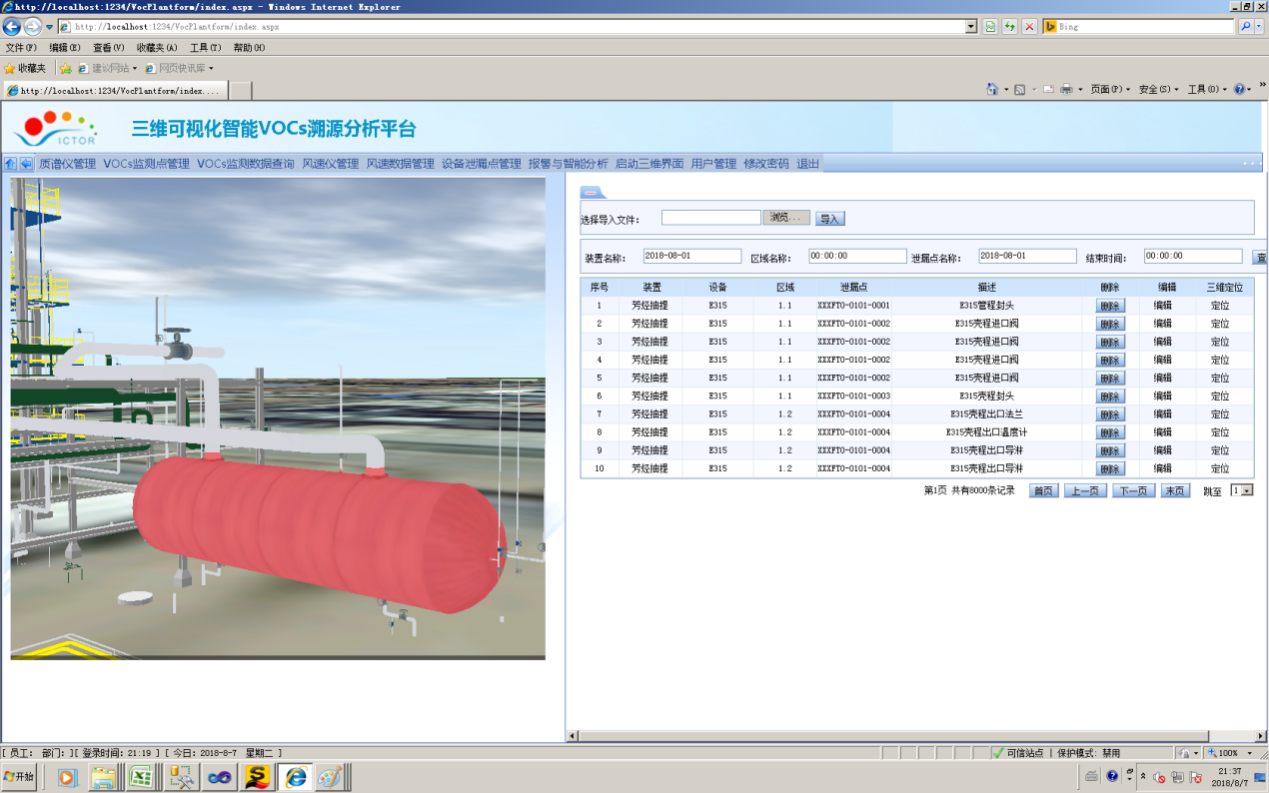
Figure 5 shows the red mark of the leakage device after traceability calculation
The wind field hydrodynamics database and traceability calculation model were embedded into the system platform. When the sampling point detected leakage, real-time wind speed and direction data were confirmed through the meteorological parameter sensor, and the corresponding model of the wind field in the wind field hydrodynamics database was captured. The monitoring concentration values of nearby monitoring points were brought into the hydrodynamic model of the wind field, and the equipment or area where the leakage source was located was calculated through the traceability calculation model (inverse calculation model such as the monte carlo mulcaf chain and the renormalization algorithm).
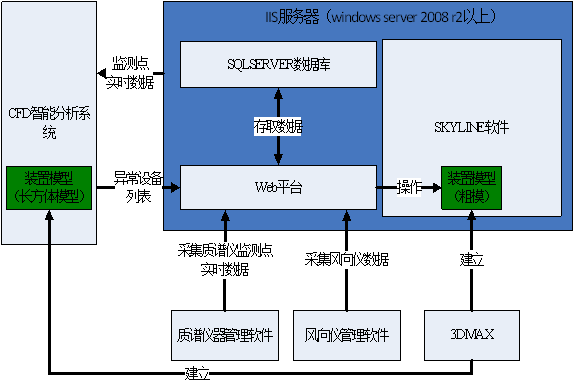
Figure 6. Logical architecture form of the system platform
Through the hydrodynamic calculation of the leakage source, combined with the wind speed and direction provided by the meteorological parameter sensor, the diffusion of the leakage is calculated, which is the pre-warning of the intended diffusion area.
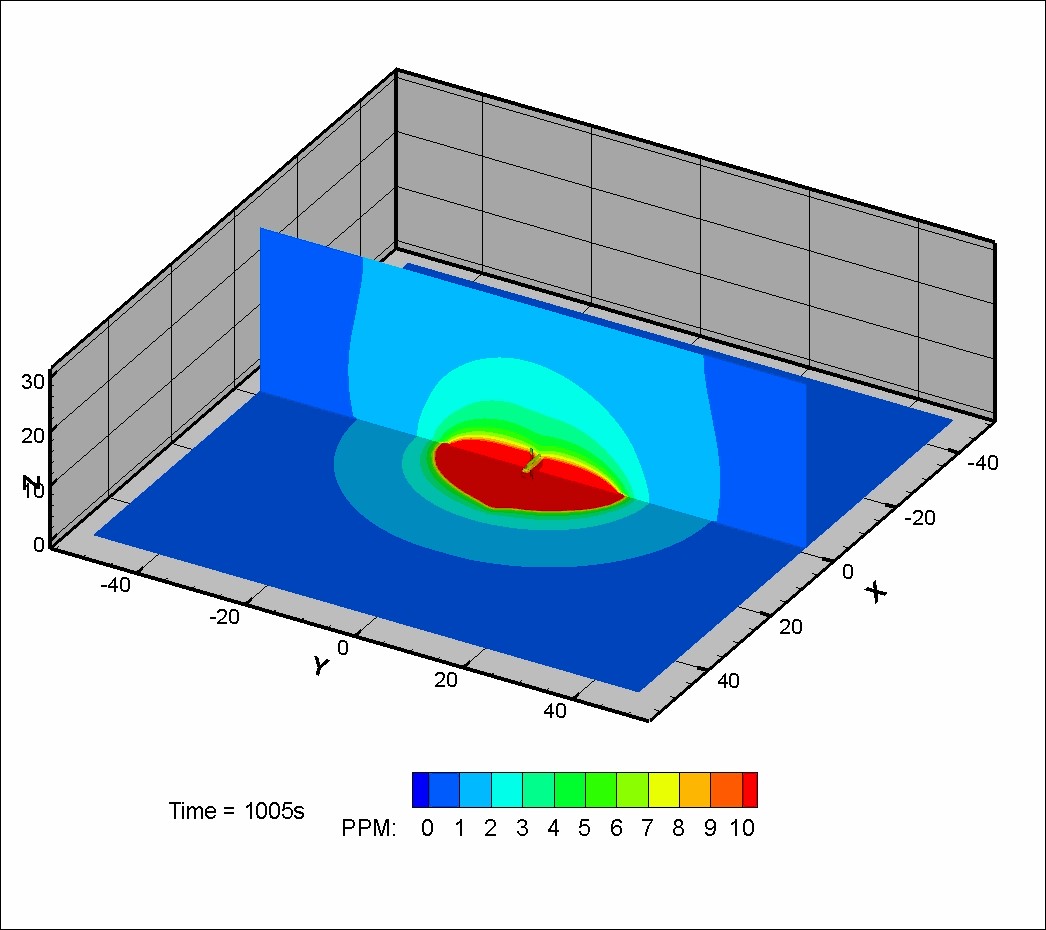
FIG. 7 distribution of leakage flow by physical calculation
The LDAR ledger of the equipment or area where the leakage source is located will be generated for testing tasks. After the LDAR test finds the leaking location, maintenance will be organized and the test data is expected to be transmitted to the VOCs MS control platform for re-inspection and repair and other control functions.
(7)Drawing design
According to LDAR wind field data analysis in combination with fluid mechanics model of a preliminary layout of sampling points, also need to on-site check location, without hindering normal inspection and operating under the premise of the owners, determine the position of the setting at each sampling point (platform will decorate a sampling point, but the tower will not enter the sample point, because the monitoring material is given priority to with heavy gas, when the wind is not big platform and ground possible leakage monitoring to the columns). Analysis cabin size 2500 (L) x 2500 (W) x 2700 mm (H), need appropriate lead near the power supply (380 v / 16 kw), wind instrument (4 ~ 6.9 bar (g)/dew point pressure and 40 ℃) and communication cables. The meteorological five-parameter sensor, the connection of the cabin and each sampling point, the connection of communication and power supply, etc. will be formed into the design drawing and material table, and the implementation plan will be prepared and submitted to the owner for approval.
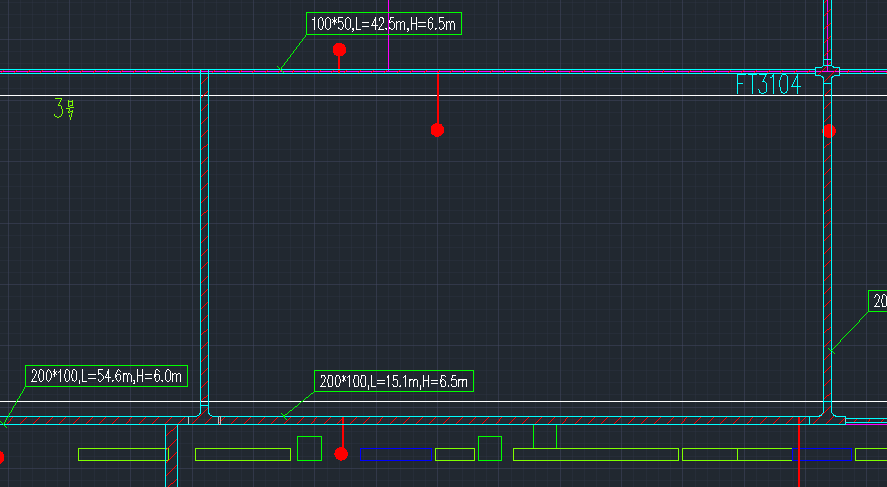
FIG. 8 design drawing of gas pipeline box alignment on site
(8)On-site installation
After the equipment and materials arrive, communicate and coordinate with the owner about entering the factory, install the gas pipeline and sampling points (between 20 and 50cm from the ground) according to the drawings, and then lead to the analysis of the cabin location. The analysis cabin and its internal facilities are a whole, and the installation method of integral pry installation is adopted. The internal mass spectrometer and pipelines have been installed in advance. The site only needs to lift the analysis cabin to the design position, and then connect with the external sampling pipeline, power supply and communication.
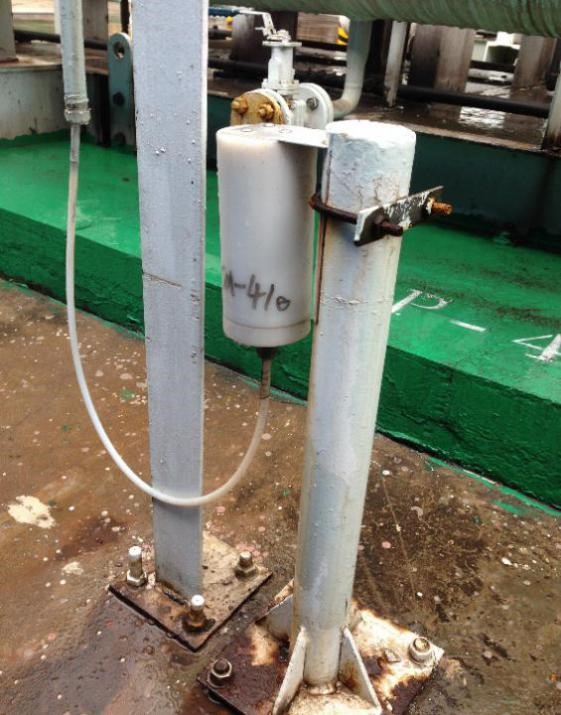
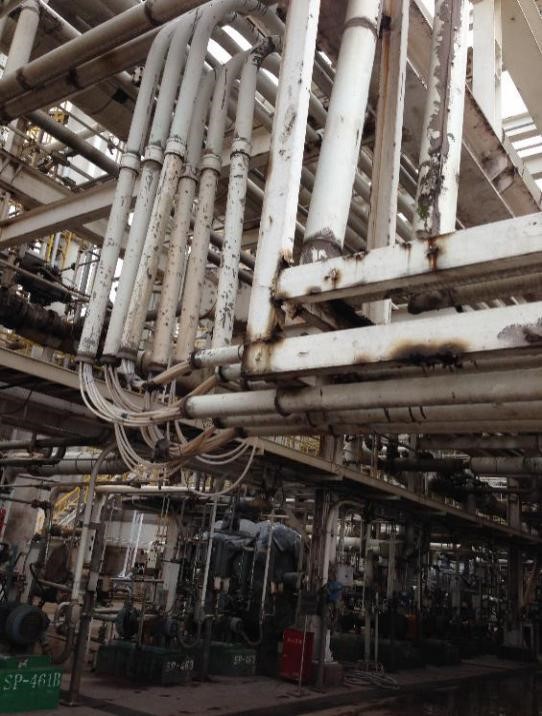
Figure 9 monitoring site installation of point and gas pipeline
左图为监测点位照片(白色圆柱体为过滤器用于除尘除水),右图为气路管线走线方式
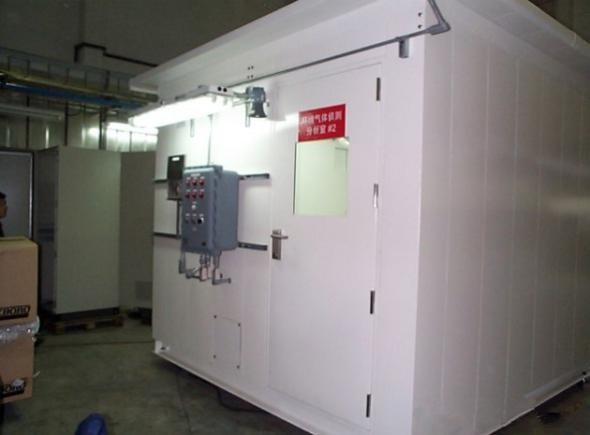
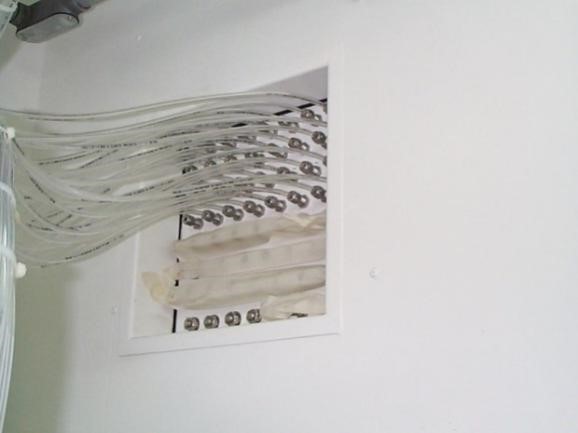
FIG. 10 integral skid-mounted analysis cabin (right picture shows the details of air pipeline entering the cabin)
(9)Site commissioning and operation
After the system installation is completed, the system equipment is adjusted for connection and communication between software and hardware, as well as the hardware performance such as the velocity stability of each sampling gas path and the response time monitoring of mass spectrometer. Record the debugging process and results, and adjust the system platforms linkage function according to the debugging data, as well as the data interaction function with VOCs MS control platform. Began trial operation after completion of commissioning, according to the actual monitoring data and leak the correction of the wind field of fluid mechanics model and the inversion calculation model, etc., and according to the actual demand adjustment point arrangement, ensure there is a complementary relationship between point, not affected by eddy current small calm wind and other special wind field, by sampling the characteristic pollutant leakage monitoring ability.
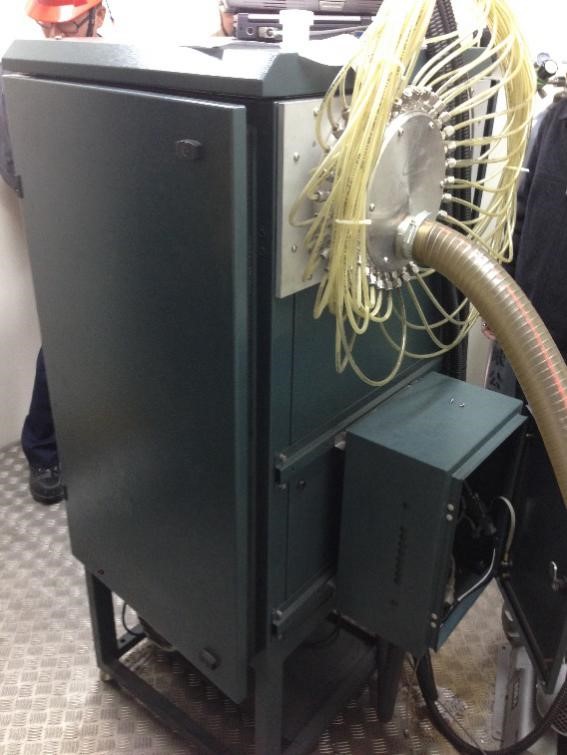
(stainless steel disk is a multi-channel sample injection device, and each pipeline corresponds to a monitoring site)
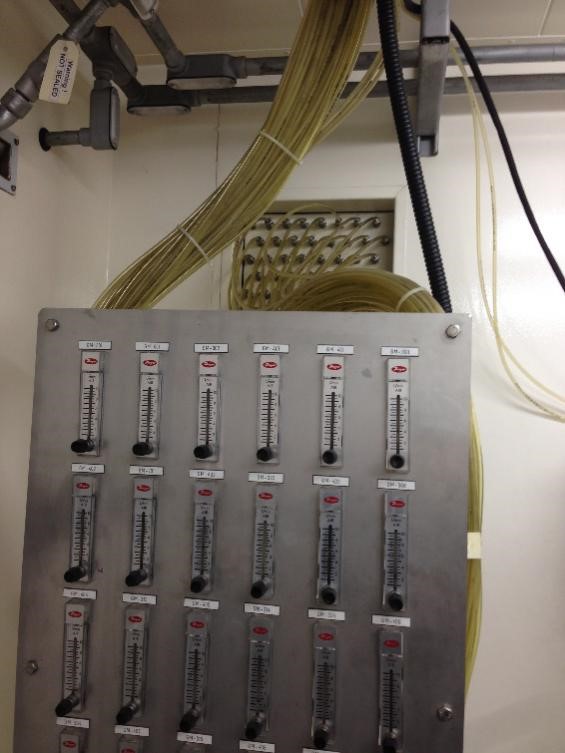
The figure on the right shows the gas pipeline entering the analysis chamber and then entering the mass spectrometer after the flow rate is stabilized by the flow meter
(10)System to deliver
After the stable operation of the system, change the relevant content of the design data according to the final site layout, collect and summarize the relevant information of the project, compile the project summary report, organize the relevant personnel of the owner to carry out system use training, deliver the relevant information of the system, and apply for project acceptance.
